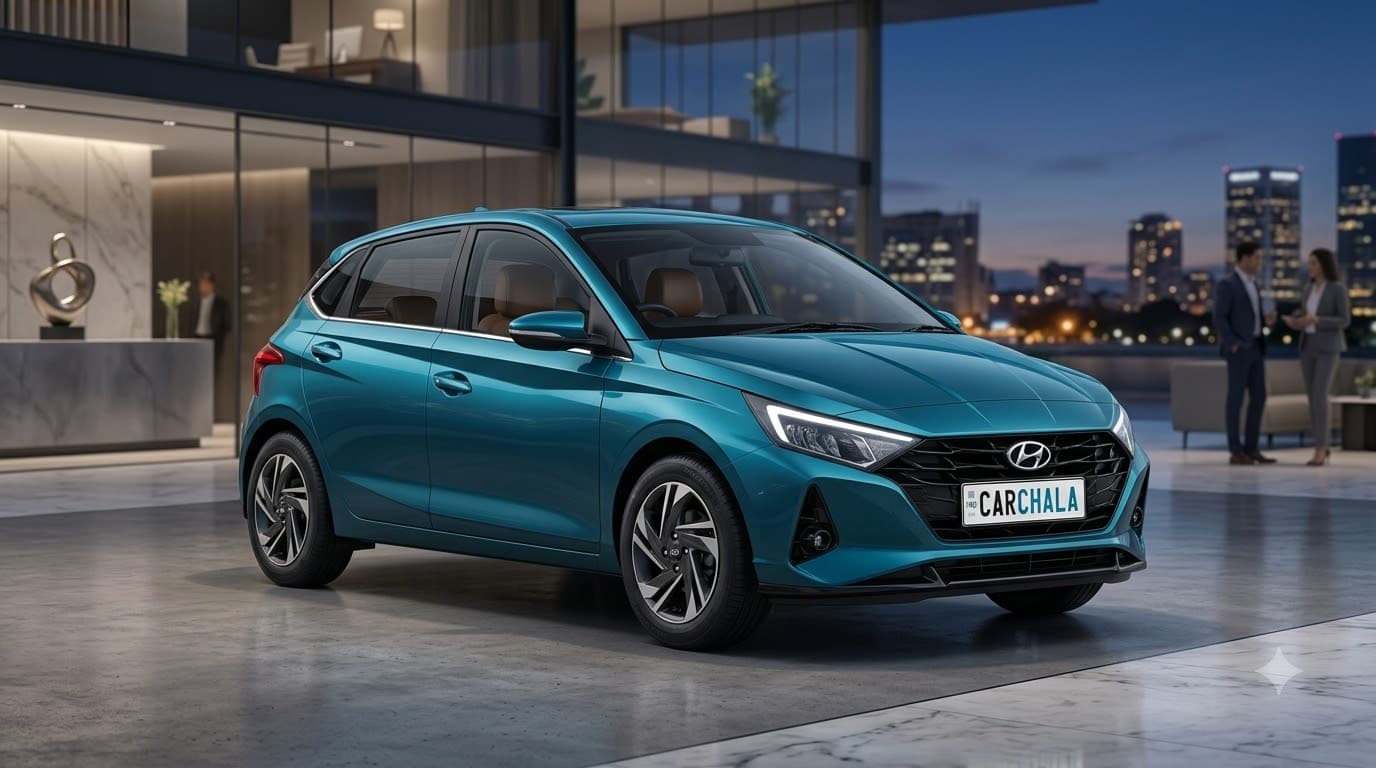
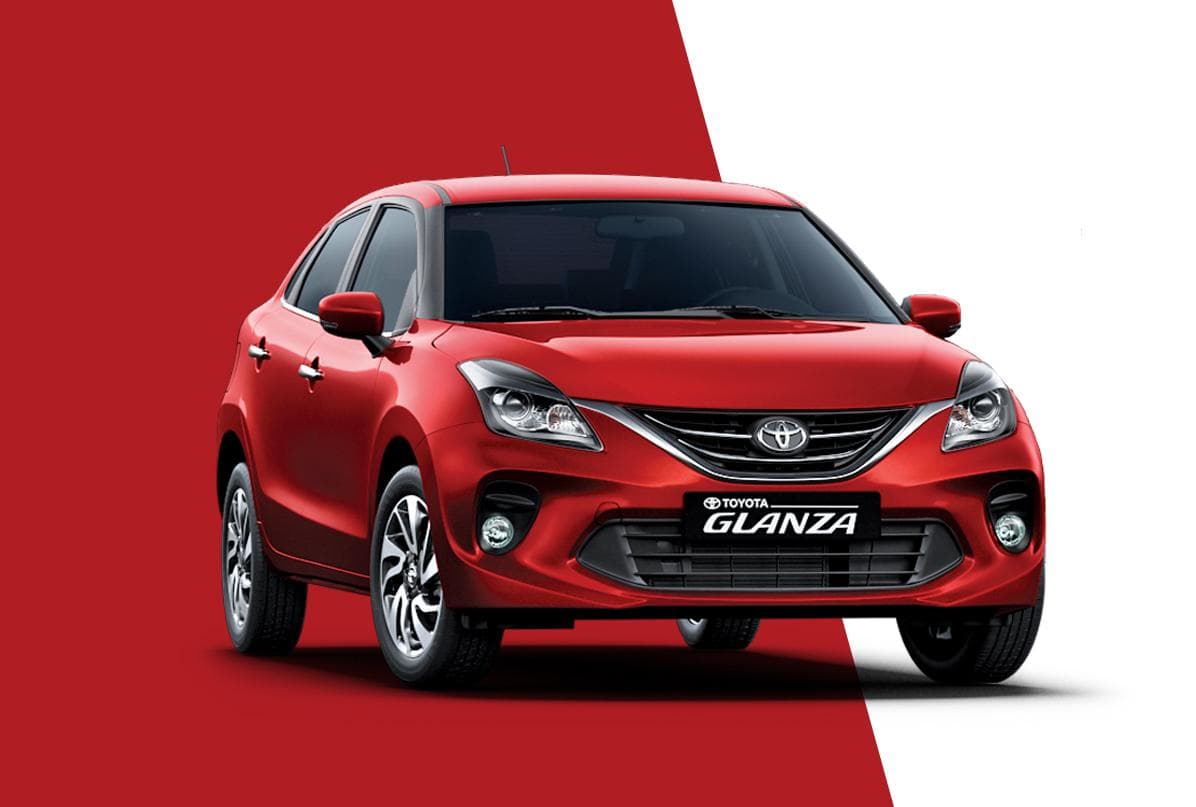
Detailed Car Comparison: Hyundai i20 vs Toyota Glanza
Comparing two distinct vehicle models side by side is the most crucial step before finalizing any new car purchase. When evaluating the Hyundai i20 vs Toyota Glanza, it is essential to look beyond just the ex-showroom price. A thorough comparison should encompass engine performance, real-world mileage, interior space, maintenance costs, and brand reliability. Our dynamic comparison engine pulls real-time data to give you an unbiased, objective look at how these models stack up against each other across more than 50 different specifications.
One of the most critical aspects of this comparison is the safety rating and structural integrity of the vehicles. In today's market, buyers must prioritize cars equipped with active safety features like ABS, EBD, Electronic Stability Control, and a minimum of six airbags. When reviewing the safety specs of the Hyundai i20 vs Toyota Glanza, ensure you are comparing equivalent variants, as base models often lack the advanced safety tech found in top-spec trims. A higher Global NCAP or BNCAP safety rating can often justify a slightly higher price tag.
Another vital dimension to consider is the long-term total cost of ownership (TCO). While one car might have a cheaper upfront cost, the other might offer significantly better fuel efficiency or lower routine maintenance costs. You should also factor in the resale value; certain brands and models historically hold their value much better over a 5-year period. By carefully analyzing the detailed breakdown of features, dimensions, and specifications provided above, you can confidently choose the car that best aligns with your budget and lifestyle requirements.
Frequently Asked Questions (2026)
Q.How do I decide which car is better in this comparison?
A.Focus on your primary use case. If you drive heavily in the city, prioritize a car with an automatic transmission and good low-end torque. If you do frequent highway trips, look at high-speed stability, boot space, and safety ratings. The 'better' car is entirely subjective based on your specific needs.
Q.Are the fuel efficiency numbers shown here accurate for real-world driving?
A.The mileage figures provided are usually ARAI-certified numbers under ideal test conditions. Real-world city driving typically yields about 20% to 30% lower efficiency than the claimed figures, depending heavily on traffic conditions and driving style.
Q.Should I compare the top variants or the base variants?
A.Always compare the variants that fall within your exact budget. It is very common for a top-spec variant of a smaller car to offer far more value and features than the bare-bones base variant of a larger, more expensive vehicle.